


Trends and cyclicality of commodity prices (part 2): questioning the commodity super-cycle
As discussed in the Policy Brief n. 17/32, which largely focused on the Prebisch-Singer hypothesis, commodity prices are subject to very long-term trends, cycles and short-term instability (volatility) (Jacks, 2013) . With this in mind, the 2002-2012 commodity price boom had led many observers to suggest the existence of a "super-cycle" driven by the structural rise of Chinese demand for commodities and, more broadly, by the economic rise of emerging countries. But prices collapsed between 2014 and 2016, and subsequently soared, inevitably raising doubts over the reality of such a phenomenon. While it seems unlikely that prices will reach new heights in the near future, the current upward trend has been consistent. Does this mean, however, that a new super-cycle is beginning, in which commodities related to the current environmental revolution will rise steadily over the next decade? What would be the consequences for African exporting countries, in particular at the macroeconomic level? This Policy Brief will address and provide answers to these questions.
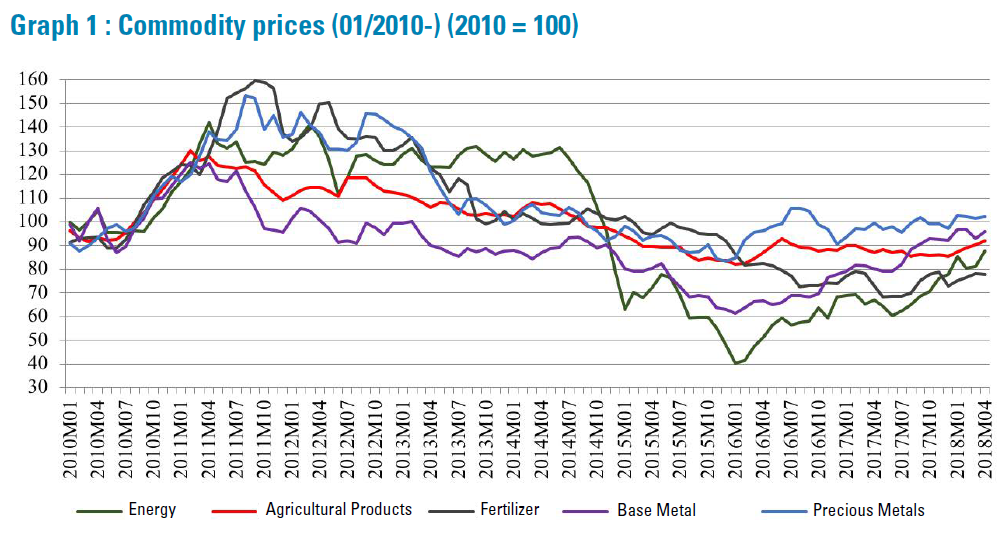
As a whole, nonrenewable raw materials have generally been spared by the adversity that has prevailed since 2012. As shown in Graph 1 below, prices in the spring of 2018 are close to their 2010 levels, far above the 2015-2016 lows. Between January 2015 and May 2018, prices grew at an average monthly rate of nearly 20% for base metals, just below 2% for precious metals and over 45% for energy. Is this a long speculative rebound, a gradual return to market equilibrium or are trends truly reversing, heralding a new cycle upswing? These movements raise questions about a possible endogenous dynamic in which rising prices eventually come down.
Beyond the very general idea that commodity prices follow a periodic trajectory at a more or less variable frequency, there seems to be no precise and consensual definition of a cycle in commodity economics. However, it might be useful to draw a distinction between a cycle and a super-cycle, using the criterion of duration of the expansionary phase. According to some authors, a super-cycle is characterized by an increase of real commodity prices over one or even several decades (ten to thirty-five years), driven by demand, in particular by urbanization and industrialization in a large economy (Heap, 2005, p. 1-2), then by a phase of depression. In this definition, a super-cycle does not pertain to a single commodity, but several and in particular in metals and energy markets, all generally impacted by structural rises in demand. While this general definition is not problematic as such, many empirical studies have attempted to identify super-cycles by commodity types. Shorter by nature, a cycle can also be specific to a set of commodities (Cuddington and Jerrett, 2008; Cuddington and Zellou, 2012; Winkelried, 2016).
In this context, it seems that the issue of cycles is twofold: identifying or measuring them (duration of phases of expansion and contraction, amplitude, etc.) and interpreting them. Simply put, the following four questions must be addressed: (1) Are commodity prices really subject to cycles and, if so, is the notion of super-cycle developed in the 2000s appropriate? (2) How can these phenomena be explained, in particular in relation to producer investment? (3) To what extent are they synchronous with real or monetary cycles? And lastly, (4) what should the policy response be: can commodity cycles be countered or, at the very least, can their most harmful effects be prevented?
Commodity cycles and super-cycles: how real are they?
Do commodity prices more or less regularly alternate between phases of expansion and contraction? To answer this question, one must agree on how to measure them. As is often the case however, there seems to be a variety of econometric methods to do so. Nevertheless, two types of approach emerge. The first relies on filters that, schematically, help to distinguish trends from cycles. The logarithmic series of real prices usually consists of three elements: trend (over 70 years), super-cycle (20-70 years) and short-term price volatility (2-20 years). The most commonly used filters are the Hodrick-Prescott (HP) filter, and the band-pass-filters of Baxter-King (BK) (1999) and Christiano-Fitzgerald (CF). The second approach relies on "dating" methods that use algorithms like Bry-Broschan's. Such methods derive from the work on business cycles (see below) initiated by Burns and Mitchell in 1946.
Analyzing the cyclical nature of commodity prices is a relatively recent endeavor, and most work on the matter was carried out from the early 2000’s. Cashin and McDermott's work (2002) on the long-run behavior of commodity prices is emblematic. The authors suggest that on average, real prices have fallen by 1.3% per year between 1862 and 1999, and observe no structural breaks. They also identified an increase in price variability, as well as a higher frequency of long phases of expansion and contraction in the last decades of the period under review (post Bretton Woods). The authors detected no fewer than eighteen cycles over nearly 150 years, including seven with long periods of expansion and decline. The work of Cashin et al., published that same year, precisely focused on identifying and measuring such cycles. Using monthly series of real prices of thirty-six commodities between 1957 and 1999 , they identified some of the specific characteristics of a cycle. A cycle is largely asymmetrical: a boom is usually of shorter duration than a bust. Similarly, the amplitude of a downturn is slightly higher than an upturn. However, the speed of expansion is higher on average than that of contraction. The likelihood of emerging from a period of low prices seems independent from the time spent in this adverse situation. Lastly, cycles differ depending on the commodity. Focusing on short cycles, Labys et al. (2000) found that, between January 1970 and July 1993, cotton and aluminum prices went through no fewer than ten cycles, versus just a short duration of three cycles for oil.
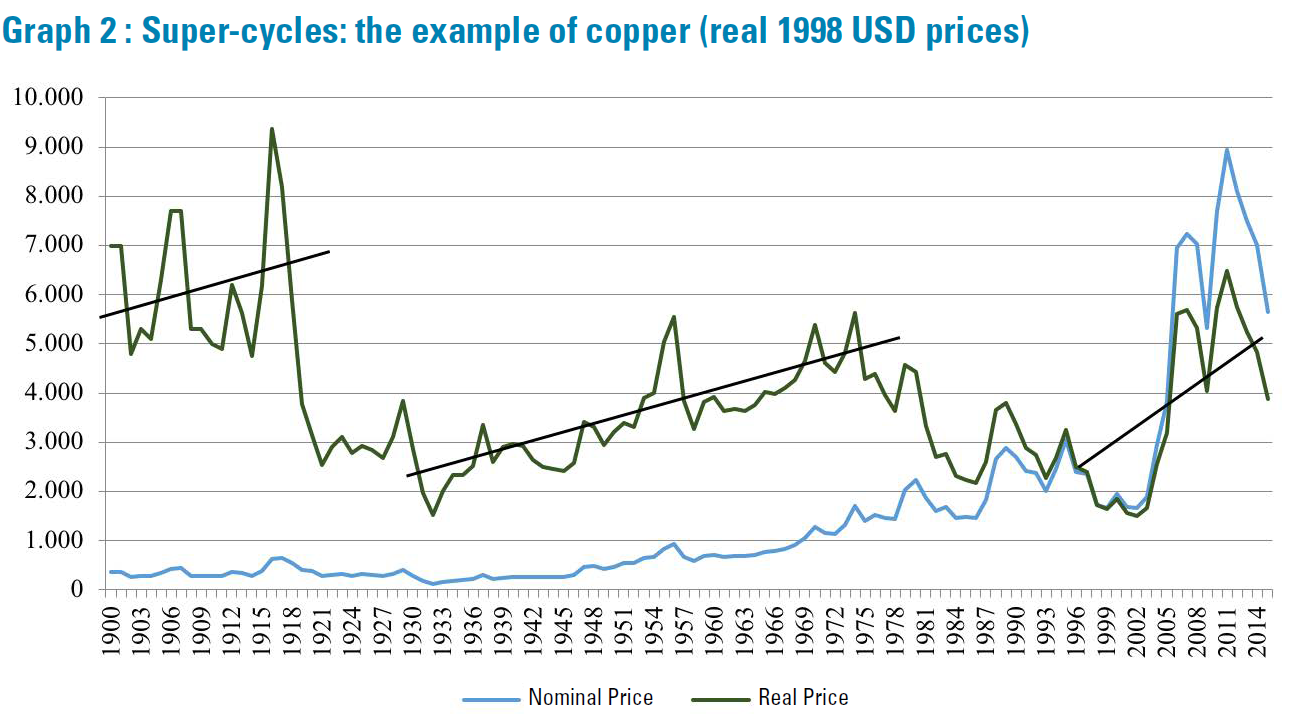
While the aforementioned empirical studies have attracted much attention in the scientific community, rarely do they mention super-cycles - at least explicitly. After prices soared in 2002 onwards, the notion gradually took hold to describe the price movements of specific commodities (particularly metals), or commodity price movements in general. Cuddington and Jerrett (2008), based on BK and CF filters, did the former. The authors used econometric methods to identify and characterize long cycles in the prices of base metals traded in the London Metal Exchange (aluminum, copper, tin, nickel, lead, zinc) between 1909 and 2006. They found four super-cycles for each metal and strong co-movement between them, underlining the importance of demand. A first phase of expansion was identified between 1890 and 1911, a second phase between 1930 and 1951 and a third phase between 1962 and 1777. At the time the article was published, the authors discussed the possible emergence of a fourth super-cycle, starting in 1999. A much more recent study by Rossen (2015) also focused on metal prices. While the period reviewed was quite similar to Cuddington and Jerrett's (2008), the commodities studied were far more diverse, from base metals (lead, zinc, etc.) to precious metals (gold, silver, platinum, palladium) to steel and other metals such as cobalt, molybdenum, antimony, bismuth. The author's approach was also different, as she used the Bry-Boschan dating method. For most metals, the findings confirmed the existence of four super-cycles since the beginning of the 20th century, with naturally few differences depending on the commodity. According to the author, steel, aluminum and cobalt underwent an additional cycle between 1958 and 1995. Cycle amplitude was found to be variable, with lower variability for steel and cobalt over the period considered (a finding that would probably change taking into account the 2015-2018 period-when cobalt prices soared). Zellou and Cuddington (2012) looked at oil prices and, unsurprisingly, confirmed the hypothesis of four super-cycles, with the first starting in 1861 and the last in 1996. Similarly, Erdem and Ünalmıs (2016) focused on crude oil prices between 1861 and 2014 and confirmed the existence of super-cycles, the last of which experienced a turning point in 2014.
Super-cycle analysis does not radically change when it examines the prices of commodities in general. Heap (2005), who was among the first to discuss this notion, only identified three: from the end of the 19th century to the early 20th century (rise of the US economy), from the end of the second World War to the first oil crisis (European reconstruction and rise of the Japanese economy), and a last one starting in the early 2000s with China's economic boom. Heap's findings were based on strong arguments but the author did not use advanced econometrics. Thus his conclusions were slightly amended by most subsequent empirical studies. Using the CF filter over the 1865 to 2010 period for 32 commodities (tropical and non-tropical agricultural products, metals, oil), Erten and Ocampo (2013) confirm that raw materials have undergone four super-cycles since the late 19th century: one cycle that started around 1890, peaking during the First World War, a second one that started around 1930 (peaking in the postwar period), a third one starting in the seventies and the last one in the 2000s. In a more recent analysis, Winkelried (2016) confirms most of the findings above. This is indicative of a relative consensus about the existence of commodity super-cycles, with phases of growth and contraction of about twenty years. Closer analysis reveals that foodstuffs undergo shorter super-cycles (the median value is thirty years), whereas metals have longer ones. Winkelried's analysis also indicates that using different databases (Grilli and Yang's analysis (1988) versus the Harvey et al. (2010) approach ) sometimes leads to different conclusions. For instance, one can identify a low point in the aluminum cycle in 1993 by using the first approach, but not the second.
Behind the cycles
Research on what drives the cyclicality of commodity prices has logically focused on possible interactions between economic activity and commodity markets. The very notion of a super-cycle, according to Heap's (2005) approach, is based on the idea that when a great nation's economy develops, this significantly increases demand for raw materials and, therefore, their prices. Such a commodity super-cycle is much longer than for global economic activity.
Exploring commodity super-cyclicality requires looking into economic cycles and their possible linkages with commodity cycles. According to traditional theories, short economic cycles such as a Kitchin cycle are attributable to stock variations, where as business cycles last about a decade and are rooted in investment behavior. Extensively analyzed by Schumpeter, Kondratieff cycles are more long-term (over 50 years) and are triggered by radical innovations. More fundamentally, a distinction must be made between analyses aiming to uncover the endogenous drivers of economic cycles, and analyses focusing on their exogenous drivers.
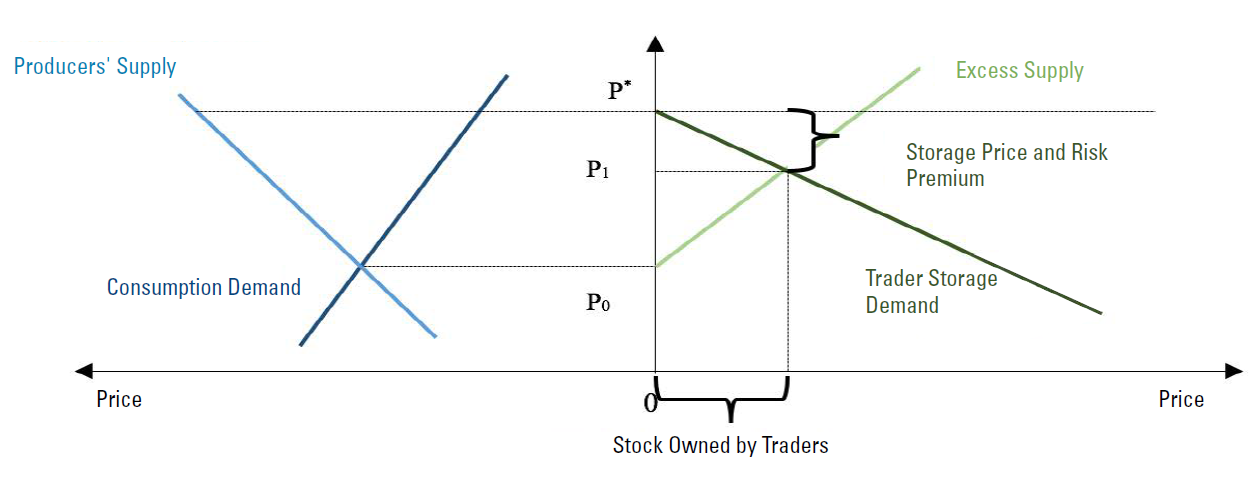
As shown very schematically in the graph above, at t0, current consumption demand from users and supply from producers lead to a price level of P¬0. However, in addition to consumption demand, is also a demand for inventory which, for the sake of simplicity, we suppose to come from physical traders. This demand will absorb excess supply on the market and will contribute to increasing the spot price of the raw material considered at P1. The larger the difference between the current spot price and the spot price expected to prevail at a later date (P*), the higher the demand for inventory, with the constraint of available storage and in the absence of a futures market.
Commodity markets are influenced in part by inventory levels and economic activity, but it is not clear that the effects of the former variable are identical. As a reminder, a Kitchin cycle lasts about 40 months and is attributable to higher demand for inventory in economic booms which, when production capacity exceeds demand, increases market supply as inventories are reduced, impacting demand. While it is true that identifying such a cycle raises a number of methodological problems and that one must be cautious in interpreting them, they do not seem to be relevant to commodity markets because inventories can be kept for a large number of reasons. To understand this, it is worth noting that with raw materials, there has always been a disconnect in space and time between the upstream, i.e. the producers, and the downstream, i.e. the users. In the time dimension for instance, agricultural supply is, by nature, periodical , whereas it seems permanent in the mineral and energy sector. Demand itself seems periodical: in the winter, demand for energy can increase while demand for minerals and metals can fall, in particular because of a slowdown in construction or because of more stringent environmental norms, as China's experience has recently shown. This seasonality could lead to infra-annual price cyclicality, but it is clear that demand for inventory (and, conversely, supply from inventory reductions) limits the impact of this dimension (Deaton and Laroque, 1996). However, it does not follow that inventories amplify or mitigate the short-term cyclicality of commodity prices. Other important reasons explain why inventories are kept, and these must also be taken into account. These include physical speculation, which can exacerbate price movements, but also carry-over stocks (Marquet, 1993) aimed at profiting from the market structure (Contango/Backwardation) when it rewards inventorying. The role of inventories has been widely analyzed to explain the dynamics between spot prices and futures prices, but, to our knowledge, few empirical studies have studied their impact on price cyclicality.

The issue of super-cycles seems much more present in the literature, especially since the 2002 to 2012 price boom. The expression has been widely used, but researchers do not seem to have particularly focused on their cyclical aspect. Many scientific articles have attempted to determine whether the boom was mainly attributable to more favorable market fundamentals or to the rise of index funds (Aulerich et al., 2013; De Meo, 2013; Etienne et al., 2014; Gargano and Tillermann, 2014). In such a context, the role of China's economic growth was the focus of much attention. Simply looking at the sheer numbers influencing China's consumption activity (economic growth, construction, automotive sector, inventory levels, etc.) gives an idea of their impact on the commodities market. Surprisingly, few empirical studies published in the period of growth have looked into a possible turning point. It must be noted that the ambiguity of the notion of super-cycle seems to have led some to believe that there could be a sort of permanence to soaring prices. This was not the case, and the downturn was severe. To address the issue of trends and cycles in commodity prices, one must analyze the price elasticity of commodity supply and demand. Tilton and Lagos (2007) note that, whereas it is commonly accepted that the supply of non-renewable resources is relatively inelastic in the short term, the same is not true in the long term. The reason for this is straightforward: the supply from extractive industries depends on far more than "simple" geological issues, such as technological, geo-political, legal, economic and financial factors. Higher prices encourage the mining of deposits with lower ore grades, the development of new technologies, and investment in exploration. This increases the capacity of supply to meet the higher demand. Therefore, to investigate super-cycles, one must identify what, in a given commodity sector, is attributable to a short-term logic, and conversely what is attributable to long-term structural dynamics. However, there is no determinism in this regard. For example, falling oil prices in the second quarter of 2014 can be explained by growing uncertainty about China's economic activity (Erdem and Ünalmıs, 2016) and by increased shale oil production in the United States, but very few economists had been able to anticipate the very high amplitude of this movement. The reason for this was that extractive technologies had advanced exceptionally quickly, reducing the cost of producing unconventional oil far more than specialists had anticipated.
Commodity cycles and business cycles: causes and/or consequences?
The duration and the amplitude of commodity price cycles naturally dictate the macro-economic choices that commodity-exporting countries must make. Short cycles require action to ensure the continuity of the fiscal policy, such as sovereign stabilization funds. On the other hand, managing longer-term cycles seems more complex. It should be recognized that, even though the notion of a cycle involves turning points, in the 2000’s it seems to have been interpreted as the promise of perpetually growing demand for raw materials by emerging countries. This evidently has not been the case: the last "super-cycle" ultimately lasted under two decades, which defies the very definition of this phenomenon.
As discussed by Kablan et al. (2017), a growing number of articles have looked into the various linkages between the macroeconomic reality of emerging or industrialized countries and global commodity markets. For instance, Belke et al. (2012) analyzed the effects of global liquidity on commodity and food prices; other authors showed that contractionary monetary policy in the US had almost immediately led to commodity price increases, with possible over-reaction effects (Akram, 2009; Hammoudeh et al., 2015). The impact of monetary variables (credit, interest rate, exchange rate) on the price of raw materials is unsurprising given the close linkages between the dollar, oil and some metals such as gold. Of course, commodity prices are not simply a consequence of variations in economic activity; for exporting countries, they also cause such variations. To the extent that a nation's Gross Domestic Product (GDP) depends on net internal and external demand, i.e. on the current account balance, any fall in the value of exports will affect the level of economic growth. In fact, the years 2015 and 2016 have shown the importance of this relationship to undiversified commodity exporters. As a reminder, during those years, GDP growth rates had sharply dropped in several African countries due to collapsing prices, oil prices in particular (Burundi, Equatorial Guinea, Sierra Leone, South Sudan, Chad). If it is established that commodity prices undergo cycles, and that these significantly influence a country's economic growth, then commodity cycles and business cycles could be strongly synchronous. This is the hypothesis tested by Fernandez et al. (2018) in a calibrated theoretical model representing the situation in emerging exporter countries (Brazil, Chile, Colombia and Peru) that have an agricultural and/or mining sector but do not influence global prices. They found that a positive shock to commodity prices can give rise to an income shock which increases demand for domestic goods, and therefore, their relative price, and lead to an appreciation in the country's real exchange rate and a deterioration of its current account balance. Though they do not include them in their model, the authors recognize two other transmission channels between commodity prices and the real sector: supply (increases in commodity output lead to higher demand for labor and higher wages) and monetary and tax policy (higher government revenue from taxes and other sources can result in more public investment). Medina and Soto (2016) analyzed the latter dimension, using a dynamic stochastic general equilibrium (DGSE) model applied to Chile and copper. Taking into account non-Ricardian households and in the absence of fiscal policy rules, they suggest that a 10% increase in the price of copper, through the Keynesian multiplier effect, causes GDP to rise by nearly 0.6% and employment by 1%. Naturally, when copper prices fall, the reverse occurs. Medina and Soto (2016) highlight that adopting fiscal policy rules for government spending (such as those implemented in Chile from 2001) can make the national economy less dependent on copper price variations. Empirical studies - such as those of Labys et al. (1999) - on co-movements between business cycles and commodity cycles confirm these findings.

Causal links between commodity markets and the real economy are obviously not limited to interactions between price levels and the business cycle. Kablan et al. (2017) observed that, as numerous academic works have established, capital inflows encourage domestic credit expansion, in turn stimulating domestic investment, and that commodity prices are strongly linked to the level of capital inflows. On this basis, the authors explored a possible interdependence between commodity price cycles and private sector credit cycles in Sub-Saharan countries where the economy is strongly driven by agricultural products (Burkina Faso, Côte d'Ivoire, Kenya, Mali and Uganda), energy (Nigeria, Angola) or minerals and metals (Niger, Tanzania and Zambia). Their findings are particularly interesting and full of insights for exporting countries. The authors confirm the existence of such interdependence in the long term, and show that it became particularly strong after 2005. It can also cause countries to become more macro-economically fragile: high commodity prices and the resulting extra export revenues can encourage the banking sector to excessively extend loans, which eventually become non-performing after prices lastingly fall. As they become more financially fragile, exporting businesses may find it quite difficult to repay their loans. If this becomes a widespread and persisting phenomenon, the country's macroeconomic and financial stability may be under threat. The authors reminded readers of the banking crisis in Mali and Burkina Faso in the late 1980s that arose after cotton prices fell in 1985. To prevent such crises, banking supervision and prudential regulation are essential.
Conclusion
Cyclicality is one of the key properties of commodity prices, no matter their type. Commodity cycles differ in their duration and amplitude, and are often asymmetrical. They are critically important for an economy, particularly in relation to fiscal policy. They are both a cause and a consequence of business cycles, depending on the country, and require dedicated measures to ensure that public investment in exporting countries can be sustained. It is also worth noting the ambiguity of the concept of super-cycle. It might convey the impression that prices could rise for decades, an impression that does not necessarily encourage policymakers to make provisions for a turning point, which will inevitably arise regardless of the underlying long-term trend. Starting in 2005, super-cycles were very widely discussed, resulting in excessive optimism that could partly explain the steep macro-economic cost incurred by some African exporters after the 2012 trend reversal. Cycles should not be confused with trends, and because some cycles are long-term, long-term counter-cyclical measures should also be implemented.
Most empirical studies on the cyclical behavior of commodity prices use physical reality as a classification criterion. As discussed above, the analysis of super-cycles reveals that cycles can also differ by country. However, recent changes in metal prices could call for a different approach. As suggested by the changes in the price of cobalt and lithium, but also copper and nickel, a new type of cycle could be developing. It is not specifically related to the business cycle or even to a country's industrialization, but to the ongoing environmental and digital revolution. Yet the question remains: is it a cycle or a super-cycle?