


Too high, too fast, too loud? Questioning the soaring prices of minerals and metals
The prices of metals -most notably industrial metals- have risen significantly since January 2016, in contrast with 2014 and 2015, which were difficult years. This trend is due to substantial improvements in market fundamentals, both for demand and supply. However, the importance of speculative movements underlying this sharp rise in prices cannot be minimized or omitted. In the short term, it poses the risk of a correction linked to profit taking and a return to greater rationality. In the longer term, it could disrupt investment decisions and eventually induce a level of supply well above that of demand. The likelihood of a market deficit due to the gradual depletion of mines can certainly be explained through basic geology, however, the economic transcription from resources to reserves may pose a challenge of greater complexity . From this regard, it is clear that the (over-) statement of expected ores and/or metals shortages often serves speculative interests. Rising prices, growing exploratory investments, technological innovations enabling the development of recycling techniques and greater efficiency in the use of materials, as well as the adoption of substitution methods have, up until now, pushed back the limits of resource finiteness.
The sharp rise in the price of "hard commodities" should, without any doubt, be among the highlights of 2017. Whereas iron has been in "negative territory" since the beginning of the year, the prices of almost all ores and metals have in fact risen significantly since the beginning of 2016, thus marking a shift from the dark years of 2014 and 2015.
Table 1: Evolution of prices of industrial metals (January 2015-September 2017)

Sources: LME, LMBA, LPPM, Datastream
Heterogeneous upward trends
There is clearly a general upward movement, however, it conceals significant differences in trajectory (Table 1). In this respect, it is probably appropriate to distinguish, within base metals, between those that have returned to their 2012 level, those that have significantly exceeded it and those that, although having progressed since the low point of the beginning of the year 2016, still fall short of that level. Within this first category are aluminum, lead and tin. The spot price (cash buyer) of aluminum on the London Metal Exchange (LME) has indeed increased by almost 17% in 2016 and is up 24% since the beginning of the year, exceeding 2,100 US$ per metric ton (MT) on October 5th. The price of lead has increased in similar proportions since January 2017 and January 2016, while tin has increased by less than 1% in the current year, after soaring by more than 42% since January 2016. It was selling for 22,240 US$/MT on October 5th 2017, against 19,400 US$ on January 3d, 2012.
Graph 1: Soaring of cobalt prices

In the second group, we find those that have largely exceeded their 2012 level, of which, first and foremost, zinc and cobalt. The latter peaked at more than 62,000 US$/MT in mid-September, when it was worth "only" 23,000 US$/MT at the beginning of 2012. The combination of significant demand (reserves) due to the production of Li-ion type batteries needed for the development of fully electric vehicles and supply constraints could only further drive the price of this resource to record levels. Priced at around 3,350 US$/MT on October 5th, 2017, zinc also experienced a speculative rise in its price: + 115% since January 3d, 2016. For zinc, it is the market deficit, still characterized by the depletion of two emblematic mines - Century in Australia and Lisheen in Ireland - in 2015 and the subsequent drop in stocks that partly explain the price surge-- if only partially…
Table 2: Evolution of prices of precious metals
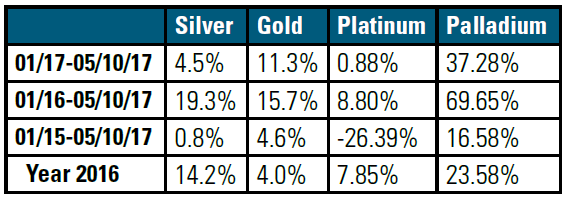
Source: Quandl.com
The prices of precious metals have also risen since January 2016, although not as much as those of industrial metals (Table 2). Rattled by macroeconomic and geopolitical factors, gold rose "only" by 15.7% between January 2016 and September 2017. The evolution of platinum and palladium prices and, more precisely, their relative dynamics illustrate an inescapable reality of the past two years. Although both precious metals progress over this period, they do at very different paces: + 9% for platinum vs. + 70% for palladium. As a result of the shift away from diesel to gasoline vehicles, the price differential between these two metals of 700 US$ per ounce at the beginning of 2012 was reversed for the first time since 2001. Priced at 928 US$ per ounce, palladium is now more expensive than platinum.
Clear improvement of fundamentals
An exhaustive analysis of the factors underlying this rise in prices of industrial metals would require emphasis on a per sector approach. Although necessarily imprecise, a more overall assessment is nevertheless possible in order to account for these new market "drivers." From this viewpoint, there are two, non-mutually exclusive ways of explaining this rise in prices. The first – and obviously least optimistic - is associated with the gradual disappearance of most bearish factors, which characterized the period 2012-2015. These include: (1) a decline in metal demand growth, particularly from emerging countries; (2) over-supply due to over-investment in previous years; (3) end of bullish speculation following the development of exchange traded funds (ETFs) and other index funds; (4) the appreciation of the dollar and (5) price wars between mining giants, particularly for iron ore.
The second, much more favorable, approach highlights the appearance of bullish factors in the last months of 2016 and the first half of 2017. On the fundamentals side, we can observe more favorable conditions with an increase in demand for hard mineral commodities. There are four reasons for this. The first is the improvement in global macroeconomic conditions, with China's growth forecast at 6.7% in 2017, US and Eurozone growth of 2.1% and global growth of 3.5% against 3% in 2016. The changes in both demand for vehicles and technologies developed in the automotive industry is the second reason for the rise in some prices. In addition to cobalt and palladium mentioned above, this benefits copper, which is widely used in electric cars, as well as nickel. The recent depreciation of the US dollar is also an important factor in strengthening the purchasing power of consumer/commodity-importing countries, chief among them China.
Graph 2: Recent depreciation of the US$ (Quotation for the euro)

Source: US Federal Reserve
Lastly, whereas the United States is more characterized by a wait-and-see attitude given difficulties implementing the Trump policy, Beijing's continued support for infrastructure spending through the New Silk Road project (One Belt One Road -OBOR) or the Jing Jin Ji mega-hub is another important element explaining what lies behind industrial metals prices, on the demand side. On the supply side, it is clear that there have been some tensions related to the rebalancing of the market with a gradual decrease in production overcapacity, or even the depletion of certain mines and/or the lowering of grades. Beijing’s stronger wish for, and commitment to, stricter environmental constraints on the extractive, metal and steel industries also account for a great deal in the evolution of prices. The Communist Party’s 19th Congress, which begins on October 18th, should, in this regard, clarify China’s ambitions in this area. As a result of supply-demand imbalance in some markets, the decline in stocks held in stock-market warehouses such as the LME or the Shanghai Futures Exchange (SHFE) has also affected market psychology.
… Which fosters stronger speculative dynamics
However, everything cannot be explained by improving fundamentals. There is little doubt that markets were characterized by significant speculative trends in the second half of 2016. Thanks to the famous "Trump rally," which led to more than a 28% increase in the price of copper between October 24th and November 28th, 2016, the red metal was able to reach 5,450 US$/MT during the first half of 2017 (LME cash price), whereas it had oscillated between 4,500 and 5,000 US$ during the same period the previous year. Copper prices were sent rocketing again during the summer. Copper hit over 6,900 US$/MT in early September, its highest level in three years. As evidenced by data from the Commodity Futures Exchange Commission (CFTC), the accumulation of money managers’ long net positions was not unrelated to this phenomenon. This is not isolated example. Nickel also reached a record high during the summer, exceeding the threshold of 12,000 US$/MT in early September before falling heavily in the days that followed. In the first quarter of 2016, the intensity of speculative activity on the Dalian Commodity Exchange (DCE) prompted China’s Securities and Regulatory Commission (CSRC), the body in charge of supervising the Chinese financial markets, to take action in order to temper speculative activities on the country's three commodity derivatives markets, of which the DCE. The open interest on iron ore contracts on the DCE amounted to 2,052,136 in January 2016 against "only" 610,012 a year earlier. Finally, what about cobalt, which, as mentioned above, now enjoys a considerable demand potential and which, as such, largely fuels the desires of certain investment funds and guides their strategies?
This strong resurgence of speculative activity is common in commodity markets. It comes after two years of sharp declines and it makes sense for speculators, who reason in terms of variations (yield) and not in terms of level, and aspire to take advantage of them. It would, however, be unwise to underestimate not only the fragility of this bounce back of prices, but also the negative consequences that it might imply. Manufacturers are probably not mistaken: although it is advisable to be cautious on this point because of how scarce data is and how difficult it is to grasp it fully, this increased demand seems to be primarily driven by the mobilization of stocks rather than by increased production, which, is itself a sign that industrialists are likely to regard this shock of demand as transitory (see Box 1).
Box 1: Transitory demand shock, changes in stocks and commodity price dynamics

Source: (Pindyck, 2001)
This graph illustrates the evolution of commodities prices following a positive but transitory demand shock. This causes a temporary increase in prices from P0 to P2 via P1, before returning to the initial equilibrium level. The reverse net demand function (i.e., reflecting excess demand over consumption) follows a positive slope when it has change in stocks on the x-axis. In other words, an increase in supply of storage demand, which is a key variable in net demand, leads to higher prices. In a transitory demand shock, this function goes from f1 to f2 but the resulting price increase is lower than in the case of a permanent demand shock due to negative inventory changes. The price then goes from P0 to P1. The disappearance of excess net demand (as the shock is temporary) will not induce a strong, symmetrical change in price due to an increase in stocks. The price changes from P1 to P2 before gradually returning to its initial level of P0.
One can consider that a fraction of the storage behavior can be explained by physical speculation (i.e. a build-up of stocks in order to take advantage of a favorable evolution of prices and not in order to satisfy industrial and/or logistical constraints). It must however be recognized that this analytical framework is very simple. In particular, it does not take into account the numerous interactions between physical and "paper" markets, i.e. those on which sector players are positioned to manage risks and speculators. From this perspective, it is a surprise to no one that commodity exchanges’ official stocks levels is one of the important variables on which speculators rely in order to implement their investment strategies on derivatives markets.
While the fundamentals of the metals markets have improved significantly, one must nevertheless remain (very) cautious about future price levels. Uncertainty surrounding commodity prices is quite natural, but in this renewed optimism characterizing metal sectors today, it is important to take full measure of this for three reasons. First, the Chinese economy remains characterized by high investment and debt ratios and has yet to fully undergo its structural change, which could -in the medium term- impact demand for hard commodities. Secondly, global growth drivers, and their main components in the coming decades, have been difficult to identify with precision. Lastly, the importance of speculative tensions currently present on the market raises issues, both in the short, and in the longer, term. In the short term, there is the risk of a major correction. Such a correction has already occurred for nickel, which lost more than 13% of its value between September 5th and October 5th, 2017.
In the longer term, it is not excluded that, if it were to continue, this speculative craze may affect the accuracy of investment choices in production capacity. Not appreciating the importance of speculative dynamics creates the conditions for under or over-investment, which may not be observed in the short term but that, by its very nature, creates conditions for a deficit or surplus offer a few years later. Let us recall, in this call for caution, that if the finiteness of mineral resources is a based on geological evidence, the idea that a shortage can occur sooner or later certainly serves speculative purposes but does not respond to the economic reality of non-renewable commodity markets. A sustained increase in prices will, in fact, tend to favor the exploitation of lower grade metal reserves, stimulate exploratory investments and, where technically possible, lead to a major research and development effort aimed at not only increasing the recycling of the commodity in question but also using alternative resources. Which should largely contribute to easing tensions on prices, as the case of platinum, among many others, has already shown.