The Mist of Central Bank Balance Sheets
Central banks of large advanced and many emerging market economies have recently gone through a period of extraordinary expansion of balance sheets and are all now possibly facing a transition to less abnormal times. However, the fact that one group is comprised by global reserve issuers and the other by bystanders receiving impacts of the former’s policies carries substantively different implications. Furthermore, using Brazil and the U.S. as examples, we also illustrate how the relationships between central bank and public sector balance sheets have acquired higher levels of complexity, risks and opacity.
Bloating central bank balance sheets (I): unconventional monetary policies
Since the global financial crisis hit the international economy in 2008, central banks in major advanced economies have widened their range of monetary policy instruments, increasingly resorting to unconventional tools. Initially to avoid a deepening of the financial destabilization and bankruptcy of solvent-but-illiquid private sector balance sheets (Brahmbhatt, Canuto and Ghosh, 2010) and subsequently to fight economic stagnation and deflation risks as private agents deleveraged, the U.S. Federal Reserve Bank (Fed), the European Central Bank (ECB), Bank of England (BoE) and Bank of Japan (BoJ) have all—in different moments and intensities—implemented programs of massive purchases of government securities and/or private assets from markets with a simultaneous creation of bank reserves on their liabilities side (“quantitative easing” - QE). Central bank policies seemed to shift towards including financial stability as a goal (Canuto and Cavallari, 2013), while uncertainty regarding counterparty risks remained elevated. To that aim, crisis-hit economies saw broad liquidity provision to domestic banking systems through QE, with the latter evolving later on to becoming a tool to boost the efficacy of interest-rate cuts.
Together with forward guidance, debt swap programs, lines of long-term loans to banks and, more recently in the Eurozone, negative interest rate policies, such use of unconventional monetary policies led to an extraordinary expansion of their balance sheets (Chart 1 – left side) (Credit Suisse, 2017). First, central banks’ balance sheets expanded by supplying reserves to assure smooth settlement of financial transactions: because of the elevated uncertainty on counterparties’ solvency, banks were hoarding those reserves instead of lending in interbank markets—also as a way to self-insure. This balance sheet expansion could be seen as “liability-driven”—i.e. originated from policies aiming at central banks’ liabilities. The second wave of expansion came from QE per se: policymakers bought assets to reduce long-term interest rates and shift portfolio compositions. Those asset purchases were financed by creating reserves, making this second expansion of central bank balance sheets an “asset-driven” one (Rule, 2015).
The asset composition moved from government bills only to various types of bonds and equities (Chart 1 – right side)—with differences among central banks mirroring underlying structural differences in shapes of local financial markets (weights of bank intermediation versus capital markets, shares of government bonds in private portfolios) (Rule, 2015). In the case of the Eurozone, institutional weaknesses, the fragmentation of the banking system and risks of country exits imposed additional challenges to ECB policies (Canuto, 2012).
Chart 1 – Advanced Economies: Central Bank Balance Sheets
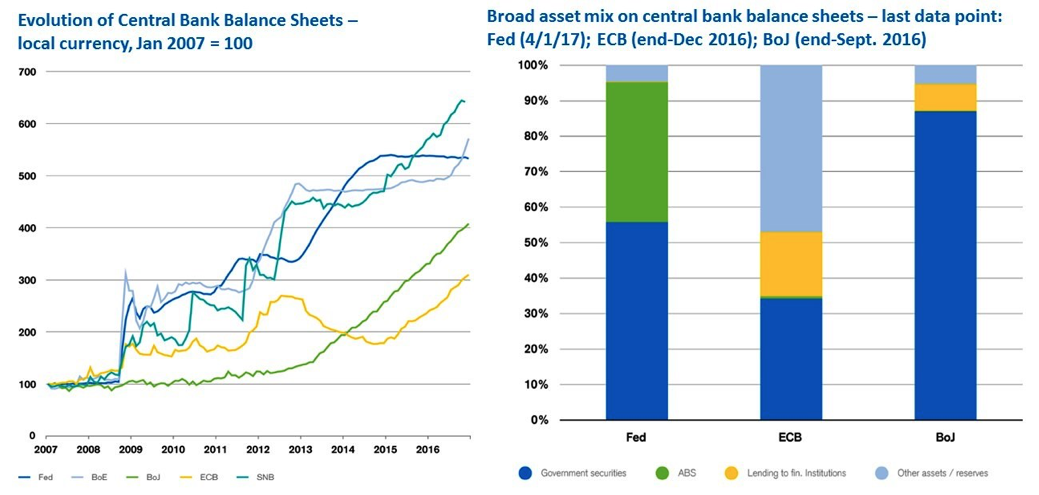
Source: Credit Suisse, The future of monetary policy, January 2017
The size and responsibilities acquired by central bank balance-sheet operations also reflected an over-reliance on monetary policy to support macroeconomic recovery. Either because of an option for fiscal austerity in the Eurozone as a whole or for early pursuits of fiscal consolidation (U.S., U.K.), opportunities to resort to fiscal policy as an additional engine were left behind (Canuto, 2014a).
There are intrinsic challenges to isolate and assess the impact of QE on macroeconomic outcomes. However, most analysts agree that, besides precluding deep downward spirals of debt deflation and bankruptcy, its transmission through lower debt service, positive wealth effects and weaker currencies (Euro, Yen) contributed to an economic recovery, including by helping banking, household and corporate deleverage in countries that adopted those unconventional policies. The size acquired by central bank balance sheets was to some extent a flipside of the over-size of domestic and international private portfolios built in the run-up to the global financial crisis, the unwinding of which would have been even more disorderly otherwise. The incompleteness of such unwinding—including debt restructuring and consolidation of portfolios—helps explain the relative feebleness of recovery and the extended time horizon of unconventional monetary policies in the Eurozone (Credit Suisse, 2017).
After almost a decade since unconventional monetary policies came to unfold, a casual observer might be asking when the policy agenda will shift to exit strategies and unwinding of central bank portfolios. Indeed, the main provider of global liquidity, the Fed, is already gradually hiking interest rates, as the U.S. economy came close to full employment. In fact, two presidents of regional Federal Reserve Banks have already expressed their willingness to shrink the Fed’s balance sheet.
Other major central banks may start exiting only later down the road, as further private sector deleveraging—or public debt restructuring—is still needed. However, spillovers from the first mover have already induced capital flows rebalancing. Lack of synchronization in paces of economic recovery will place additional challenges for orderly balance sheet adjustments.
There are strong reasons to believe that there will be no return to the pre-QE configuration of balance sheets (Credit Suisse, 2017). Together with the pro-recovery motivation for central bank policies, structural and regulatory factors have contributed to their balance sheet dynamics, and made central banks not just market regulators, but also “quasi-market makers”. First, the increasing global financial integration in the last decades has imposed increasing challenges to make liquidity management effective as cross-border volumes of capital flows expanded significantly. Second, changes in financial regulation have induced private agents to alter their behavior and strategies. Basel III requires banks to carry a minimum amount of high quality liquid assets, which could be met by simply holding reserves at central banks. These rules have discouraged banks from receiving short-term cash balances from institutional investors and made central banks the only remaining player able to provide liquidity services. Finally, central banks may need to accept an increasing role as funding providers, as banks are not incentivized to use short-term balances for arbitrage trades. Thus, a new task came under the purview of central banks: monitoring relations between various benchmark curves—i.e. operating as quasi-market makers. One may expect that the “new normal” configuration of central bank balance sheets will not necessarily be as bloated as the one during recent “abnormal” times, but will not return to the pre-crisis size and profile.
Bloating central bank balance sheets (II): spillovers from abroad
As financial markets started normalizing globally in the wake of acute crisis moments, unconventional monetary policies generated a collateral effect by shifting abundant liquidity to other countries—small advanced economies and emerging market economies (EMEs) mostly casual bystanders at that point (Canuto, 2013a). Until the 2013 “taper tantrum” started to affect EMEs following the Fed’s first announcement of a forthcoming end of QE, liquidity excesses eventually turned into massive capital flows to those countries (Canuto, 2013b).
Capital inflows had already led to a piling up of foreign currency reserves in recipients—particularly when accompanied by high current account surpluses—prior to the global financial crisis. After a slowdown in the immediate aftermath of the crisis, those flows and the corresponding reserve accumulation returned with strength for some time, until slowing down again more recently (Chart 2) (Canuto, 2016). The intensive wave of capital flows to EMEs in between the crisis eruption and the “taper tantrum” reflected unconventional monetary policies in large advanced economies, combined with enthusiasm about what then seemed to be a steady “growth decoupling” of the former (Canuto, 2011). It is worth noticing the higher weight of short-term flows and bond purchases in the QE-influenced wave comparative to previous periods (Canuto, 2014b).
Chart 2 – Selected Economies: Gross International Reserves 2005Q1-2016Q1 (In billions of U.S. dollars)
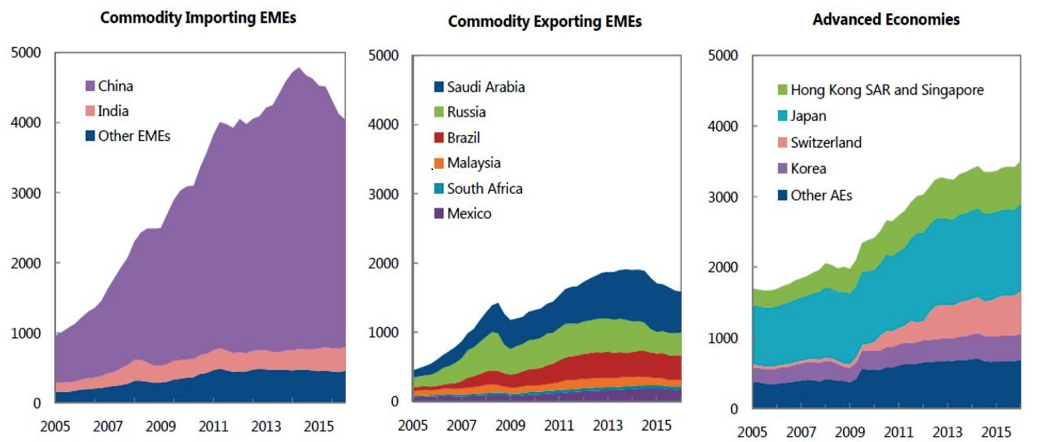
Source: IMF, External Sector Report 2016
While capital inflows and reserve accumulation had already been leading to challenges faced by monetary policymakers in EMEs, these were exacerbated by the features of the QE-originated wave (Canuto and Cavallari, 2013). Even an EME not “manipulating exchange rates” —i.e. pursuing strategies of curbing domestic demand and deliberate exchange rate undervaluation (Canuto, 2017)—would not be expected to take a hands-off approach to exchange rate pressures and allow the “liquidity wave” from abroad to be fully absorbed via local currency appreciation. Therefore, accumulation of reserves with corresponding central bank balance sheet accommodation became the norm. Holding up against local currency appreciation while sterilizing monetary impacts of reserve accumulation meant expanding balance sheets of recipient EMEs—an “asset-driven” increase of the central bank balance sheet (Rule, 2015). That was a major factor behind several EMEs’ central bank assets reaching proportions of GDP comparable to those of economies adopting unconventional monetary policies (Chart 3).
Chart 3 – Central Bank Total Assets to GDP ratio (2015)
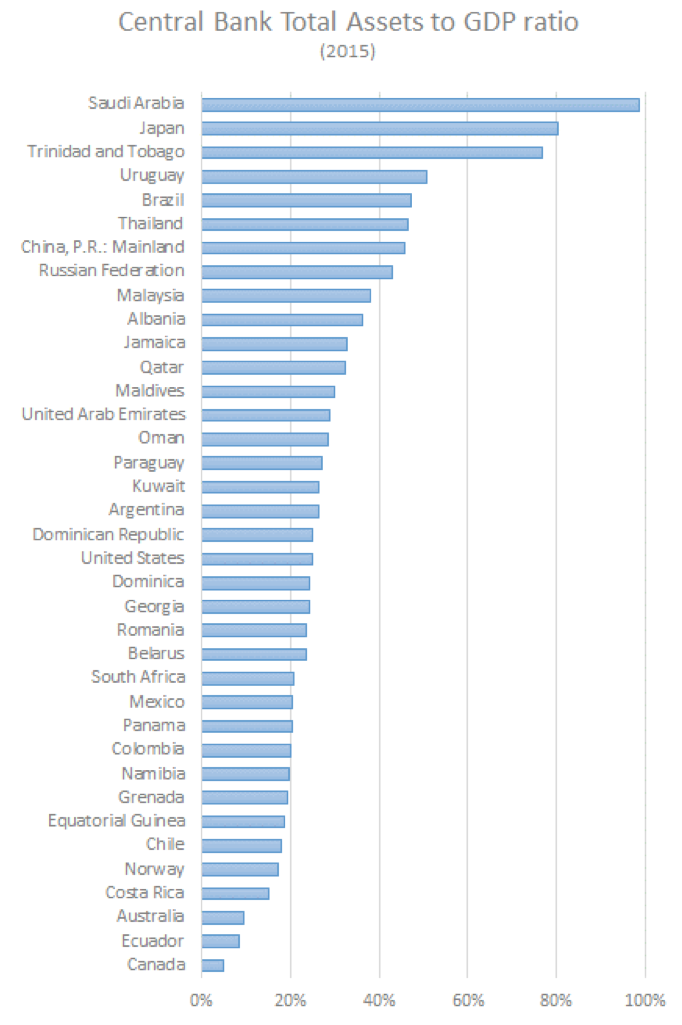
Source: International Financial Statistics, IMF
Differences in monetary policy frameworks
From the standpoint of the component of reserve balances in central bank balance sheets, unconventional policies in advanced economies shifted their banking systems from a “structural deficit” of reserve balances to a “structural surplus”. EMEs in turn, by then already with a long history of surplus reserve balances—usually caused by exchange rate interventions, government financing and, sometimes, provision of assistance to unhealthy banks—had asset-driven surpluses intensified by QE (Gray and Pongsapam, 2015).
There are three basic means to sterilize monetary impacts of asset purchases—foreign assets and government or private securities—when the central banks intends to outweigh their initial effect as additions to commercial bank reserves on the liabilities side: (i) retaining them as additional required or voluntary free reserves, fine-tuning the corresponding remuneration in the latter case; (ii) issuing central bank own securities; and (iii) using government securities held in their portfolio to make “reverse repo” operations with the private sector.
Central banks vary widely in the use of those tools. Ferreira (2016) compares the cases of Brazil (BCB), Fed, ECB, Mexico (Banxico) and Korea (BoK) and remarks that:
1. The sterilization of central bank purchases of private assets, government bonds and foreign assets was mainly done with retention of remunerated voluntary reserves (mainly Fed and ECB) and issuance of central bank own bonds (notably Korea). Fed and BCB are not legally authorized to issue own bonds (Chart 4a).
2. Brazil is the only case where reverse repos based on government bonds were the predominant tool. Relatedly, government bonds held on the asset side by the central bank had to augment considerably in order to make feasible the ramp up of foreign asset accumulation and its sterilization. That explains the tall sizes of both foreign assets and government bonds in BCB’s assets as a feature unique to Brazil in this group (Chart 4b). It also is part of the explanation of why the bloating of BCB’s balance sheet took it to a size equivalent to almost 50% of Brazil’s GDP, substantially taller than all other central banks in the group—see also Chart 3.
Chart 4a – Selected Countries: Central Bank Liabilities 2015 (% of GDP)

Source: Ferreira, C. L. K. (2016), « A dinâmica da dívida bruta e a relação Tesouro-Banco Central », in Bacha, E. (ed.) O Fisco e a Moeda: Ensaios sobre o Tesouro Nacional e o Banco Central – Em Homenagem a Fabio Barbosa, Civilizaçao Brasileira.
Chart 4b – Selected Countries: Central Bank Assets 2015 (% of GDP)
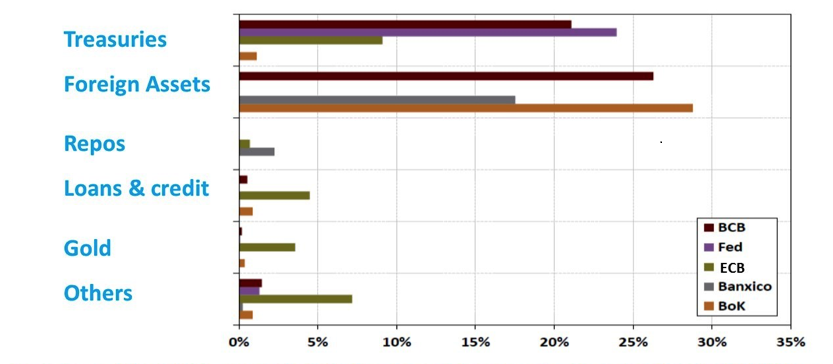
Source: Ferreira, C. L. K. (2016), « A dinâmica da dívida bruta e a relação Tesouro-Banco Central », in Bacha, E. (ed.) O Fisco e a Moeda: Ensaios sobre o Tesouro Nacional e o Banco Central – Em Homenagem a Fabio Barbosa, Civilizaçao Brasileira.
Relationships between central bank and public sector balance sheets: it’s complicated!
There are multiple channels through which monetary policy and central bank balance sheets interact with government fiscal accounts and balance sheet. Bloated central bank balance sheets have magnified the weight and the complexity of that web of relations, one in which country-specific institutional features matter. Let’s offer some examples.
Take for instance the unique Brazilian over-reliance on reverse repos for monetary sterilization approached in the previous item. As observed, BCB relies mainly on reverse repos to drain liquidity surpluses, being current reserve requirements considered already high. So, the monetary authority sells—with repurchase agreement—government bonds from its balance sheet, and the Treasury supplies those bonds if needed to avoid losing control of the policy rate.
That tool has an accounting implication beyond the monetary policy realm (Ferreira, 2016). It implies that Brazil’s general government gross debt as measured by the International Monetary Fund (IMF) and most other analysts is higher than what would be the case if there was no single reliance on reverse repos and therefore less need to hold so huge volumes of government securities in BCB’s balance sheet. The standard method to account for gross public debt is to consider all public debt in the central bank balance sheet, including even the extra buffer held to minimize the risk of losing the capacity to set the monetary policy rate. It is fair to say that this part of the gross public debt corresponding to assets held by BCB and not by markets should not be treated as a result or a component of Brazil’s fiscal and public debt dynamics. Cross-country comparisons of public debt should take that into account.
Ilan Goldfajn, BCB’s president, has recently declared that remunerated voluntary deposits will be added to the monetary policy toolkit in the near future, offering a remuneration equivalent to reverse repos. The stock of the latter has reached levels above 16% of GDP of last year and over time shall be partially replaced with remunerated voluntary reserves, with relevant fiscal accounting implications (Romero, 2017). By following the Fed’s practice of paying interest on banking reserves, the central bank’s portfolio of government bonds could be reduced. Consequently, the gross public debt, as compiled, for example, by the IMF, would be lower.
Another connecting channel between fiscal and monetary policy realms is made by occasional profits and losses incurred by central banks in their operations. That is a channel that has now, obviously, become much more significant than in the past.
An example comes from Fed’s “Operation Twist” in 2011 and 2012, a debt swap program in which the Fed bought long-term Treasury bonds in the market and sold short-term Treasury bonds to flat long-term interest rates. The transaction amounted to hundreds of billion dollars. The Fed holds these long-term bonds in its assets, where an increase of 100 basis points in interest rates of the 30-year Treasury bond would impose up to a 20-percent loss on their value. In January 2017, the Fed’s balance sheet had up to 55 percent of government securities and close to 40 percent of Asset Backed Securities (ABS) (Credit Suisse, 2017).
Despite implicit potential losses in the Fed’s balance sheet, Operation Twist is directly accounted as part of U.S. gross public debt. Moreover, the Fed has profited from the difference between negative short-term real interest rates and the positive yield-to-maturity on the long-term bonds. By buying ABS and drying up the surplus of reserves, the Fed also pays interest on these reserves. This “carry trade” has been profitable for the Fed. Profits amounted to up to U$ 97.7 billion in 2015, being transferred to the U.S. Treasury in 2016 (Chart 5 – left side). However, this picture can revert dramatically as short-term interest rates rise and the yield curve steepens.
Chart 5 – U.S. and Brazilian Central Bank Remittances to the Treasury
.png)
The Fed’s capacity to pay interest on reserves and resort to the latter as a sterilization tool—seen in the previous item—is not an old practice. It was introduced to avoid losing control of monetary policy from the QE collateral effects (Bernanke, 2015). Hypothetically, a situation could arise that might make the Fed run out of Treasury bonds to sell in the market. However, paying interest on reserves affects central bank’s profit—there is a budgetary impact—and does not require government bonds as a collateral. Therefore, the gross public debt would be higher than in the case the monetary authority had kept using reverse repos to drain liquidity excesses, such as in Brazil, creating distortions in cross-country comparisons.
Another example of this complexity—and risks and opacity—acquired by fiscal-monetary links in the era of bloated central bank balance sheets associated to central bank operational income comes from Brazil (Chart 5 – right side). Given the magnitude of foreign assets held by BCB, like some other EMEs, exchange rate oscillations often lead to significant central bank non-realized gains and losses in local currency.
In Brazil, central bank’s income is legally mandated to be transferred every six months to the Treasury Single Account on the liabilities side of the BCB’s balance sheet. Chart 4a exhibits how high has reached the balance in that account. According to Mendes (2016) and Ferreira (2016) to a large extent this stems from the treatment of gains and losses from non-realized results from exchange rate variations—which are accounted apart from other balance sheet items. While gains have been deposited in the Treasury Single Account, losses have been compensated with government transfers of new public bonds to the BCB’s balance sheet. Over time this has raised balances on both the Treasury Single Account (liabilities) and Treasuries (assets).
By the same token, there are challenges associated with the accounting of results from foreign currency swaps, which were intensively adopted by BCB during and after the 2013 “taper tantrum” in order to smooth local currency depreciation pressures. By design, swap results are in opposite direction to the ones from actual foreign reserves: e.g., actual exchange rate depreciations imply local currency gains with the BCB stock of foreign assets, while there is a simultaneous payment of premium on (smaller) notional values of swaps. Nonetheless, while the latter are non-realized, the former is accounted in the fiscal balance.
Final remarks
Nobel Prize Sir John R. Hicks argued that monetary systems and institutions are particular to each epoch in history. In that context, he wrote in his “Monetary Theory and History” (1967):
“Monetary theory is less abstract than most economic theory; it cannot avoid a relation to reality, which in other economic theory is sometimes missing. It belongs to monetary history, in a way that economic theory does not always belong to economic history” (p.156).
Such variability and evolutionary nature of monetary systems and institutions over time also has a flipside when it comes to space. Analyses and policy choices on monetary and financial systems cannot rely simply on abstract and universal principles, and is obliged to take into account historic-specific contexts.
That historical specificity of money and finance was shown here in our approach to the two recent distinctive-but-combined types of experiences of bloating balance sheets lived by central banks. Furthermore, we saw how variegated and country-specific the array of monetary policy tools and institutions is. On the other hand, as this recent evolution does not seem likely to be unwound and reverted, all share in common the challenge of facing new risks and complexity coming with the “new normal” of central bank balance sheets.


