


Global Commodity Markets 2015—2016 Forecasts
Rarely, has the global market trends in raw materials and commodities been as pronounced as in 2015. Virtually all markets overall were down strongly as predicted by the Cyclope-Rexecode index with an average drop of 38% in 2015 compared to 2014. It is easiest to cite a few products that ended the year on a net positive: cacao, tea and olive oil among agricultural products, and potash among minerals. For the rest, the largest declines took place for oil and iron ore (a barrel of oil and iron ore throughout the year held about the same value), milk powder, natural gas, nickel and ocean freight for dry goods. Thus, the end of 2015 was essentially a return to 2004 or 2005 in current dollars, putting an end to the "cycle" of strong pressure that started during that period and which lasted a bit under ten years, or for approximately the investment period. Note, however, that it is somewhat important to keep this fall in perspective in light of the rising dollar, with the exchange rate that on average has improved by 14% in 2015. In order to understand such a fall in prices, it is necessary to analyze both the short-term factors and long-term trends. In the short term, the key elements were the behavior of producers and to a much lesser extent the doubts about Chinese prospects.
Producer responsibility
In 2015, producers continued defense strategies for many products, and even conquest of market share resulting in genuine trade wars. This was primarily the case of oil with the willingness of Saudi Arabia to play on volume in the hope - still hypothetical in early 2016 - to "get out" of the US shale oils market. Another reason was OPEC’s inability to achieve even a semblance of agreement on quotas. But the case of oil – however exemplary - is not unique. What can be said about the attitude of iron miners – and in particular Australians - who continued to increase their production even as Chinese demand was beginning to level off: although production costs remain below market prices in early 2016, they have so far failed to reduce the supply of their less well-positioned competitors. It is the same for aluminum, in this case with Chinese producers maneuvering for dairy products even with New Zealand and in a very different sector with marine cargo for both dry bulk and containers. There were certainly some announcements in 2015 about reducing production capacity,
particularly with respect to non-ferrous metals, but these have generally been insufficient or too late even although a number of dedicated production investments occurred between 2005 and 2010. In regard to minerals, it is interesting that the only markets that held out were the potash and phosphate markets through the highly oligopolistic production structure. But for most other products, oligopolies were warring in 2015.
In agriculture, the agricultural conditions were also optimal despite the threats raised in the spring of a new "El Niño" episode. This materialized in only a limited manner and in general crops reached record levels in 2015. Faced with this oversupply, demand continued, especially from China.
Subdued performance in China
A number of hasty analyses have linked the commodity markets debacle to the Chinese "crisis" and to the China’s slowing growth.
Changes in global prices (2015 average over 2014 average, in %)

Admittedly, this is indisputable and at year end China reached less than 7% growth. Certainly also, lackluster Chinese financial markets (in August 2015 and January 2016) have seen increasing movement and caused a stir on listed commodity markets in China (minerals and metals) in a challenging environment: products such as copper, nickel and even iron ore have struggled. But so far China has not reduced its imports and probably not even its consumption, even though it is difficult to distinguish between real needs and stocks, whether they are strategic or speculative. Chinese demand decreased the most for powdered milk, which has been little mentioned. On the other hand, iron ore imports remained at the 2014 level and imports of most non-ferrous ores increased again (even if it this is what increases the Chinese exports of steel and aluminum). Like soybean imports, crude oil imports increased by nearly 10%. China has even become the world's largest sugar importer.
To assign the responsibility to China for the commodities prices debacle is not only exaggerated but also wrong even if the appreciation of the Chinese risk by investors has greatly amplified a movement that, at times, has been close to panic.
Generally, in a world with growth of about 3%, the demand for commodities is sustained even if many producer countries, such as Brazil, Russia or Venezuela went into recession and in response had to strongly readjust their currency parities.
Dollar strength
The dollar has appreciated by about 15% in 2015 (on average) against producer country currencies such as the Brazilian real, the Russian ruble or the Argentinian peso, as well as against the euro, the Yuan, and others. The correlation between the dollar’s evolution and commodities prices is troubling particularly in crisis periods like in 2015-2016. It is clear that many producer countries have had no choice but to let their currencies "slip" to give some breathing room to their primary or secondary sectors. Expressed in reals or in rubles, agricultural prices are therefore up.
Once again monetary instability has been decisive even if the market fundamentals first explain the general downturn in 2015 and the gloom that prevailed in the early 2016 when the financial thunder rumbled in Shanghai.
What price floor for 2016?
For many markets, the existential question for 2016 is: when will prices reach their floor and what will that price floor be? For oil or sea freight, aluminum or pork, sugar or natural gas, the answer to these questions depends on both objective data in terms of production costs, as well as more subjective elements based on producer expectations. There is a tendency to underestimate the resilience of producers facing price declines, and their ability to reduce their costs or to produce at a loss while expecting better days. In 2015, dry sea freight, natural gas in the United States, aluminum and nickel were perfect examples of markets where the majority of the producers did not even cover their operating costs without however adjusting production. In 2016, American shale oil, European pork, coal and iron ore will be added to this list.
In addition, world prices will always be subject to weather, and geopolitical and monetary risks. In 2016, the climate could take a much greater importance as the 2015 threats materialized moderately: La Niña following El Niño; after a mild and dry start to the winter in the northern hemisphere, an increased risk for seedlings; and consequently the impacts of climate change continue to outpace us.
The geopolitical dimension is also likely to be even more significant for oil certainly with the friction between Saudi Arabia and Iran, as well as for all countries destabilized by this new evidence of the curse of raw materials. For oil producer countries, and for countries producing minerals and metals, the wake up call will indeed be increasingly painful, defaults cannot be excluded, as in Venezuela, and a strong destabilization of fragile economies and political systems too often bears the stamp of corruption.
Coe-Rexecode commodity price indexes in $Global indexes

Coe-Rexecode commodity price indexes and effective exchange rate of the dollar

Cyclope’s 2016 economic forecast

Cyclope’s 2016 forecast (2016 average over 2015 average, in %)

The weakness of global prices will however be an asset to consumer countries, both developed and less developed countries. Overall, global growth is expected to be around 3% in 2016, with China being a major unknown factor, just as in 2015: our scenario for China is one of a gradual slowdown in growth, just under 7%, probably more pronounced for industrial production. We estimate that steel production will level off in 2016. This will result in stagnated iron ore imports, for example. We cannot completely exclude a crisis scenario, with growth falling below 5% and heavy political and social consequences. This is a veritable threat to all markets, including China, which is the main buyer.
Finally, there is the monetary parameter. With wise caution – compelled by the US election year - the Fed will continue its upward movement in rates and logically the dollar should continue its increase against the euro and the yen. It may be the same case for many emerging and commodity producer countries. The main unknown is again the evolution of the Chinese currency, the Yuan. In any event, the dollar’s continued appreciation will weigh upon global markets traded in dollars.
But with climate and geopolitical conditions being constant, there is little chance of significant rebounding and markets are entering a period of depressed prices probably much longer than most of the current analyses anticipate.
Long-term outlook
The chapter has thus ended for the 2006-2014 market crisis. This follows the logic of the shocks that occurred during the twentieth century and the last of which lasted from 1972 to 1980. During the 1970s, soaring commodity prices based on fears of shortage (stopped growth) and oil crises induced a wave of investments and innovations that have been successful in the 1980s and precipitated the collapse of markets in 1991, further accentuated by the end of the USSR. The low point was reached in the late twentieth century, and it took many years of production capacity adjustments and the emergence of China's needs from 2002 for the markets begin to rebalance and then take off again starting in 2005.
Will it be the same this time? The investments made between 2007 and 2012 are beginning to materialize in terms of production and - as we have seen - agricultural, mining, or oil producers have only somewhat yet altered their strategies. Now is a time of surpluses, which will probably continue for a long time. Logically, the adjustment will take even longer as a jump in demand cannot be anticipated, as was the case at the beginning of the century with the emergence of China. Eyes should be on India, which is for now, despite its growth, closer to China’s situation in the early 1990s. Our long-term scenario is that depressed world markets will be maintained for a few more years before another shock, which may occur in the 2020s perhaps related to India’s continued emergence.
But in the meantime, markets will retain their highly unstable and volatile nature. Despite the relative success of COP 21, global governance has made little progress in 2015 and the prospect of the US elections ensures that this unstable and volatile nature continues in 2016.
Cyclope 2015 was subtitled "For Whom the Bell Tolls?" and the poet reminded us that it rang for us all. It will ring again in 2016.
2016 price forecast
Energy
The whole energy sector is down sharply indicating a veritable energy counter-shock that undermines the good energy transition resolutions taken at COP 21. There is little hope that this changes in 2016.
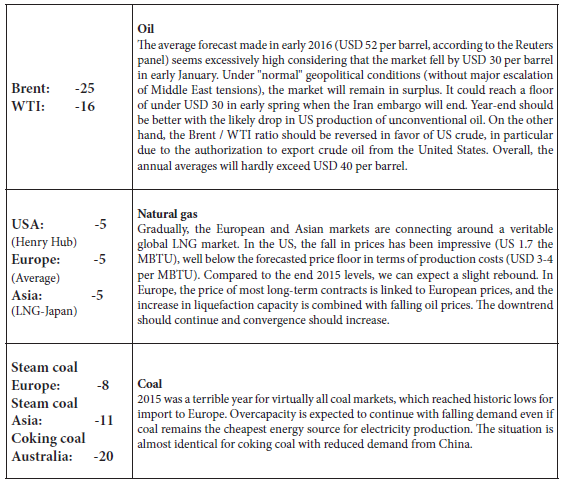
2016 price forecasts
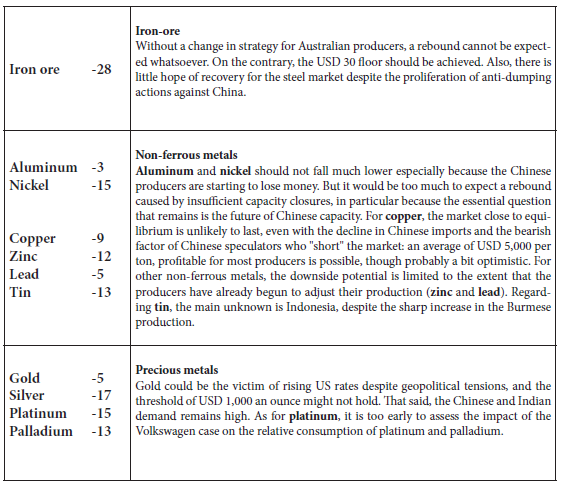
Metals and metal ores
The decline was overall in 2015, beyond all expectations. Nothing points at a much improved performance for 2016 even if it is likely that many commodities have hit their floor and will barely fall lower given the reality of their production costs. But the resilience of producers to operate at low prices, even lower than operation costs, is often much greater than anticipated. More than for the other markets, ores and metals are particularly sensitive to Chinese uncertainties. China is the world's largest consumer, most often the largest importer, and increasingly a particularly destabilizing exporter (steel, aluminum, and metals). The products can be divided into two types: those for which the late 2015 levels can be considered as floors (nickel and aluminum), or be close to the floor (iron ore), and those for which a downside potential is still perceptible (copper, etc.). In any case, 2016 will be a difficult year for mining companies, for which the "Golden Age" is over.
2016 price forecasts
Fertilizer
Although the phosphates and potash prices were maintained in 2015, those of nitrogen fell sharply in the wake of natural gas. These trends are expected to continue in 2016, mining producers can thus more easily adjust to demand despite the Chinese uncertainties.
2016 price forecasts
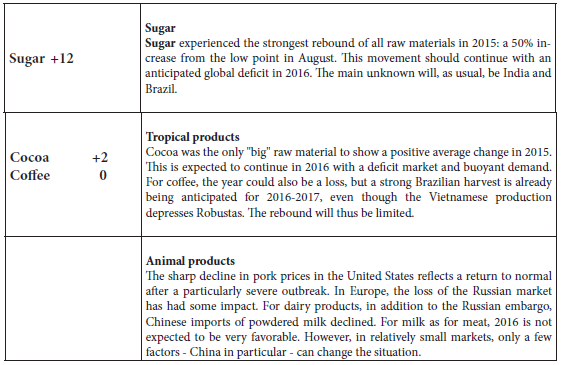
Food commodities
In 2015, the decrease in food commodity process was the lowest of all the raw materials in spite of a favorable climate and excellent harvests in particular in the northern hemisphere. If El Niño was the big topic of the year, it must be noted that its impact was very limited, at least 2015, with some surprising exceptions, such as cocoa on a regional basis and corn in Southern Africa. On the other hand, in 2016 the unknown climate impacts are stronger with of course El Niño and eventually La Niña, as well as concerns about the winter sowing in Russia and Ukraine and the consequences of precipitation in the United States. Of course, all forecasts that follow are based on "normal climatic conditions," which in 2016 seems somewhat random.
The situation was much more difficult for livestock production including dairy, which explains the 19% drop in the FAO index which, unlike Cyclope, includes animal products.

2016 price forecasts
2016 price forecasts

Adjusted 2015 Cyclope forecast
It is always a challenge to correct forecasts made a year prior, and in early 2016 the effort was somewhat masochistic. Frankly - aside from less catastrophic figures than expected - Cyclope had not anticipated the extent of the decline in world prices. By reasoning in terms of annual averages, we expected a decrease of 27% of Cyclope’s overall indicator at 38%. This is due of course to oil whose decline (-46%) surpassed our expectations (-35%). Beyond energy, the bearish bias for minerals and metals was most notable in particular for nickel, iron ore, tin, and to a lesser extent for aluminum and zinc. Each time, the levels considered as the floor were hit and lowered.
For many markets elsewhere, reasoning based on "this cannot fall lower" has been reversed, the best example being dry bulk (the Baltic index) whose rates have continued to fall (by -36%, which is double the forecast) and for metals, aluminum and nickel are now well below production costs.
Our main mistake is having underestimated the resilience of producers facing lower prices and even their ability to further increase production, as was the case for iron ore and of course for oil.
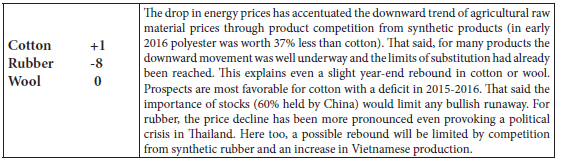
On the other hand, while 2015 has been a relatively quiet year from a climate perspective, our forecasts were more accurate for agricultural products with an almost perfect prediction for wheat (-14% compared to a forecast of -15%) and cotton.
Overall, the monetary factor (the higher dollar) had been a bit underestimated, which may explain stronger price declines in the dollar than we expected, especially as this has particularly affected the currencies of countries that export raw materials (Brazil, Russia, etc.).
Finally, the most significant mistakes relate to tropical products, coffee and cocoa: for coffee, the expected deficits did not materialize and for cocoa, the weather was the issue.
In total, the large expected decline has indeed occurred, but at the beginning of 2016 the floor is much lower than predicted by Cyclope, however pessimistic, one-year prior