


2016: rebound year for hard commodities?
After registering significant declines in 2015, the prices of non-renewable commodities rebounded during the first four months of 2016 resulting in a key question for many countries and economic stakeholders: can November 2015 be regarded as the low point of the cycle, suggesting a markets recovery, if not sustained, at least sustainable? The hypothesis seems reasonable, but recent crude oil developments have shown that the precautionary principle must prevail when attempting to predict the development of commodities prices. A speculative surge, a temporary upturn linked to supply pressures and a substantive improvement in fundamentals? The question still remains open. One thing seems nevertheless certain: price volatility will remain high for the duration of the year.
In double digits: this is how the extent of the 2015 price drop can be simply characterized for almost all non-renewable commodity markets, including energy, minerals or metals: a -14% monthly average for gold, and up to -40% for nickel or iron ore. Players and observers of the hard commodities market greeted what resembled a rally with relief during the first weeks of 2016. Fueled in part by a negative demand shock with sometimes severe macroeconomic consequences for producing countries, admittedly the fall in prices was worrisome. If this price drop could at first seem favorable to importing countries, it is indeed also rooted in a bleak macroeconomic situation, particularly in some emerging countries that had, in previous years, established themselves as important sources of growth for the global economy. From its 2015 low point, reached on November 23rd (1,423 USD / ton), to its highest in early 2016 (1,672 USD / ton), reached on April 29 2016, the cash price for aluminum on the London Metal Exchange (LME) increased by almost 17.5% (Chart 1). The same for nickel, which logged the worst performance in 2015: its price experienced a similar progression from its low in 2015 and its best point during the early months of 2016, peaking on May 3. In contrast, the rebound was weaker for copper, which reached 4,515 USD / ton on November 23rd to exceed the 5,100 USD threshold on March 18th, an increase of 13%.
Figure 1: Price performance of metals (01/2015-05/2016) (Index base 100 on January 2, 2014)
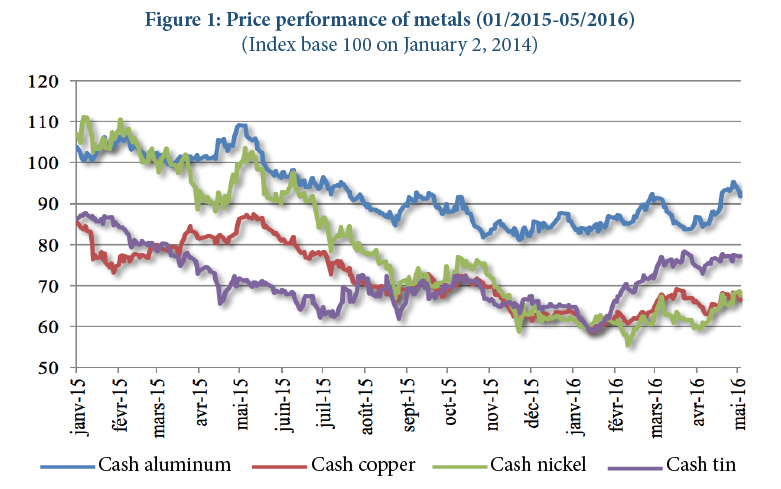
Source: Datastream
Steel has also recovered strongly. The rebar contract price quoted on the Shanghai Futures Exchange (SHFE) has indeed increased over 13% since the beginning of 2016 to reach 2,106 yuan per ton on May 19, after having reached over 2,800 yuan in mid-April. In the wake of steel, the price of iron ore has also rebounded somewhat in late March to USD 55 per ton CFR Tianjin port, while it was trading below USD 40 at end December 2015. In terms of energy, the crude oil references (Brent and West Texas Intermediate, WTI) have also picked up at about USD 27 per barrel for both (Figure 2), after hitting bottom twice, WTI on January 18 and Brent on February 10, 2016. Brent and WTI increased over 37% between December 21, 2015, when they hit their floor values for the year, and May 25, 2016, when they exceeded the symbolic threshold of 50 USD / bbl.
Figure 2: Price performance (01/2015-05/2016) (in USD per barrel)
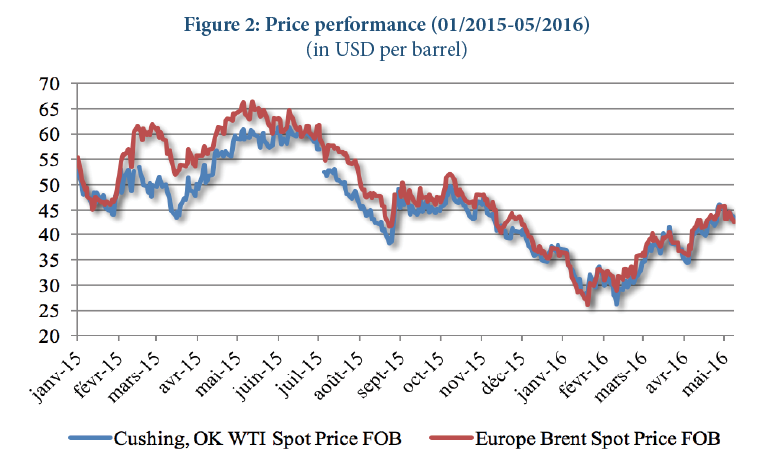
Source: US Energy Information Agency
To state the obvious: the rise in mineral, metal and energy prices has multiple origins, combining macroeconomic and global political reasons with specific industrial explanations due to the behavior of firms with, for each approach, both objective and market psychology dimensions. In the absence of ambitious empirical studies on this issue, if it seems difficult to understand the impact of each of these variables, their identification is nevertheless possible.
Clearly, there are economic reasons that explain what may now be understood as a turning trend: declining commodity prices observed since 2014 are fueled by excess production capacity, and it is logical that the progressive market rebalancing will result in a rise in prices. This explanation has naturally had a special resonance in the oil sector where not only the historical OPEC and non-OPEC producers seemed to converge on a supply reduction agreement in order to support prices, but also because the US shale gas producers have gradually left the market. While the Energy Information Administration (EIA) estimated that US production would be 8.6 million barrels / day (mb/d) in 2016 and 8 mb/d in 2017, after having reached a record of 9.4 million in 2015, the data reflect the weakening of the North American supply: in April 2016, production reached 9 mb/d, down 7% over a year. Still on the supply side, the increase in production disruptions also explains not only the rise in prices, but also reducing the contango observed on Brent and WTI, an explicit sign of market rebalancing. This is particularly the case in Venezuela, where the country’s decline, and the crisis the national company PPDSA is experiencing, pose serious threats to its oil production capacity, down sharply in the first quarter of 2016 compared to the same quarter the previous year. This contracted supply is also observed in Libya as well as in Nigeria, the top crude producer in Africa, plagued by security problems, where the activity of four of the five main export terminals in the country, including Qua Iboe, the largest of them, was impeded by site occupations or sabotage. The country's production has reached its lowest level in 22 years, at 1.4 mb/d. The recent Canadian forest fires in the province of Alberta, which is the main production area of the country's oil sands, compounded this effect. According to the ANZ bank, approximately 2.5 mb/d have been withdrawn from the global market because of these supply issues. Other analyses estimate 4 mb/d.
Figure 3: US production of crude oil (in millions of barrels per month)
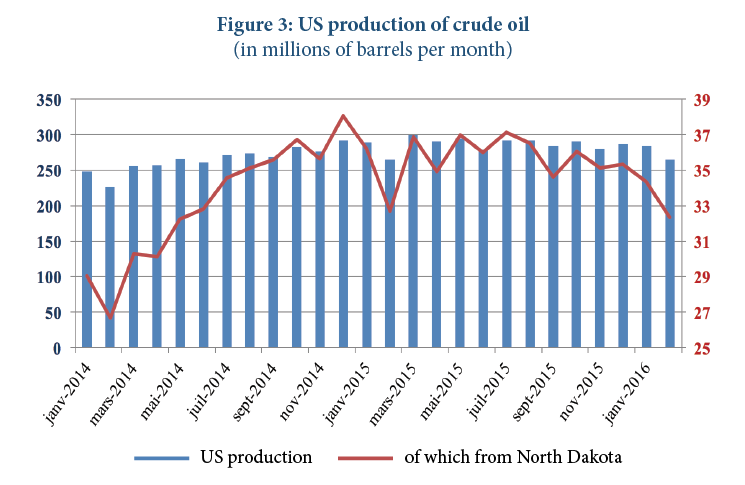
Source: US Energy Information Agency
With oil demand rising, one would assume the largest yet price rebound. Not only should the production volumes from Russia and the Gulf countries be taken into account, but also significant global stocks that would be able to quickly make up for any decline in supply. A tightening of US monetary policy could also appreciate the US currency and thus increase the cost of oil imports, which could again weigh on demand. Keep in mind that in the oil industry, as in virtually all of the commodities industries, including agriculture, the investment cycle operates in the long-term and if the investment has decreased sharply since 2014, the effects of past investments have not yet all been felt. New production capacity will indeed drive the market in the coming two years. Uncertainty about the behavior of supply and demand on the US monetary policy, or on the level of production in exporting countries, can therefore be easily understood: without even taking into account the complexity of political interactions that play within and outside OPEC, the price dynamics equation remains particularly difficult to resolve. If we stick to the fundamentals, however, it appears clear that the market remains in surplus, at 1.59 mb/d for OPEC in 2015 according to the IAE. However, this surplus has fallen sharply and should continue to do so in 2016 and 2017.
Figure 4: Balance on the global crude market (excluding inventories)
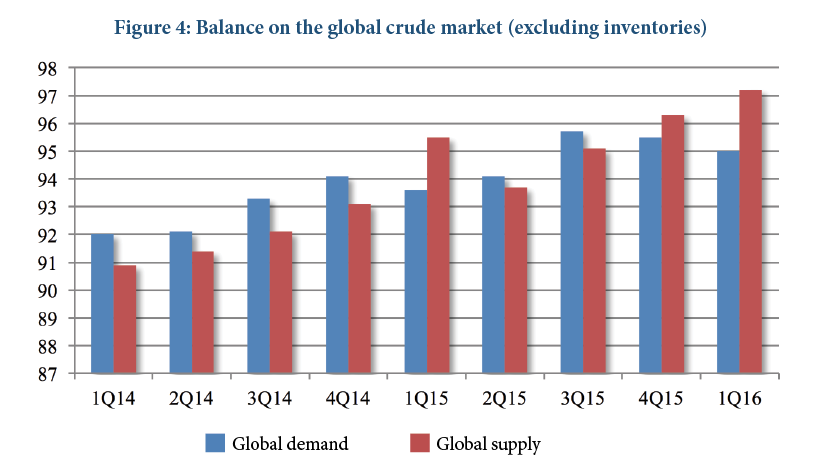
Source: International Energy Agency
The dynamics of commodity markets always have an impact on a global dimension because of the importance of macroeconomic factors, and it is therefore not surprising that the mineral and metal markets have similarities with those of fossil fuels. The steel, aluminum or copper market rebound is in fact primarily rooted in supply behavior where the first effects of the price collapse have been felt not only on the supply levels but also on the production capacity of industry giants. The explosion of Chinese metal production, observed over the past three decades and intended to satisfy booming domestic consumption, created the conditions for saturated markets worldwide from 2014 until now, even as Chinese demand was faltering. In 2015, having produced 822 million tons of crude steel of a global total of 1.67 billion MT, Chinese steelmakers are indeed undisputed leaders in this sector. In a context of slowing domestic demand, the shift by a fraction, however small, towards export markets of the quantities produced, was likely to permanently undermine the industries of other producing countries. That's indeed what happened in 2014 and 2015. This was also the case in the primary aluminum industry. Therefore, the markets could favorably view any curbing of the Chinese supply, or, at a minimum, any credible commitment to achieving a supply reduction. The first quarter of 2016 was an example of this, with an estimated world production for that period of 385.7 million tons, down 3.6% from the first quarter of 2015. In terms of macroeconomics, a further easing of the Chinese monetary policy, after the devaluation of the yuan in August 2015, could also be a factor supporting the metal demand in China, and therefore the prices.
Figure 5: Price dynamics of Singapore Iron ore future # 2 (in dollars per metric ton and in % of daily variation)
Source: quandl.com
Make no mistake, however: the signals from the commodities giant are ambiguous: In March indeed the production by Chinese steel makers reached 70.7 million MT, up 2.9% compared to March 2015. It must be said that in China as in most of the producing countries, except India, the steel production capacity reductions should have considerable social impact and in the short term could dull the reality of political commitments. Moreover, the SHFE operators were not mistaken by a drop in the rebar contract price of 19% between May 5 and May 19, 2016. This is indeed not surprising and it is where financial variables come into play, beyond macroeconomic factors and industry explanations. Most major mining groups are widely leveraged due to mergers and acquisitions undertaken when prices hit record highs, and engage in strategies to sell off and write-down assets. The goal: meet shareholders demands. If this results in a gradual reduction of production capacity, it explains the rise in prices. The need to make financial resources available to meet their various financial obligations could lead them to again raise their production levels once prices have sufficiently increased. They would then resume this short-term approach strategy that had largely fueled the 2015 price drop. Still on the subject of financial variables, there is no doubt that the price dynamics will be influenced by investment fund speculative strategies, both hedge funds and mutual funds, since most base metals and energy products are quoted on organized markets. The era of index funds or trackers, which took advantage of the upturn in the commodities super cycle (2002-2011), does seem to have completed. A more pragmatic speculation of increased short term purchase and sale operations should thus assert itself in 2016, exacerbating de facto price volatility, and making the implementation of hedging strategies more complex for operators in the sectors in question.
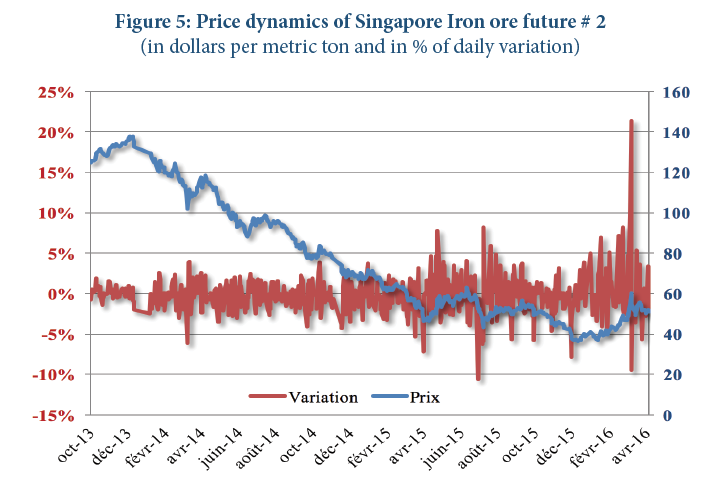
What is in fact surprising about the early 2016 developments (that is if the irrational exuberance of the markets can still surprise), it is not so much the observed rebound – after two or three years of virtually uninterrupted decline, was it not normal that the markets finally resume? – than it was its vigor. This overlooks market psychology, in this overall equation. Whether one is on the commodities markets, forex, or stocks, they are a matter of conviction and mimetic opportunism. In this, it is not so much the macroeconomic or industry variables that affect the commodity prices per se, as it is the way that financial markets on which they are listed react. Since end 2015, the idea that commodity prices had hit a low point seemed firmly entrenched in the minds of operators, and any good news a priori reinforced this "end of the tunnel" feeling. Thus, when the Chinese government reiterated its desire to reduce national steel production capacity, the price of an iron ore future contract traded on the Singapore Commodity Exchange surged over 21% on March 7, over the course of a single day, an event never seen before (Figure 4). The surprise is in fact only relative, as it is known that the commodity derivatives markets have always been catalyzed by speculators’ moods and will. To cite one of the most recent episodes of this irrational exuberance: the mini-crash in the nickel market at the end of March 2015, when the metal lost over 12% in a week, was it not caused by a massive short selloff fueled by prospects of weaker stainless steel demand in Europe and China?
The result of this multiplication of variables, explaining the price dynamics and the inability to accurately determine which ones will be decisive, is that volatility should be expected in 2016. An IEA study confirms this: volatility levels observed for crude prices in March 2016 were the highest since 2009. This should also not only impact the commodities prices, but also market valuations of mining and oil companies. It is therefore appropriate to recall how it can sometimes be futile to question the level of future prices, whether of commodities, currencies, stocks or other assets traded on a financialized market. Markets cannot be understood using a one-dimensional logic (will the price go down or up?), but –at a minimum– two-dimensional, where the price level is cross-analyzed with that of volatility. Continued analysis of the markets imposes a further questioning of the future "market structure" level (will the contango increase or decrease?), because it is partly what determines not only the strategy of storage operators, but also influences the effectiveness of the hedging strategies of commodities producers and users.
Ultimately, it appears highly unlikely that a sharp rebound occurs in 2016 on mineral, metal, and energy markets as long as supply and demand conditions display contracted characteristics. In a context marked by uncertainty, this does not yet mean that fly-ups may occur because of unexpected events limiting supply.However, caution is advised before drawing definitive conclusions. Provided that market fundamentals have not improved significantly and the operators’ turmoil not offset, there is indeed a priori no lasting trend expected before 2017.